Visualization
Beyond the tabular and profile-based summaries of a distribution, dit can
render the structure of a multivariate distribution graphically.
Information UpSet Plots
Venn (or Euler) diagrams are the traditional way to depict the information
diagram of a joint distribution, but they become unreadable beyond three or four
variables. UpSet plots [LGS+14] are a scalable alternative for
visualizing intersections among many sets. The InformationUpsetPlot
casts the atoms of a distribution’s Shannon information diagram (its
ShannonPartition) as an UpSet plot,
so an arbitrary number of variables can be visualized at once.
Each column of the plot is an atom of the information diagram, e.g.
\(\I{X_0 : X_1 \mid X_2}\). The dot matrix encodes membership: a filled dot
means the variable participates in the atom, while an empty dot means it is
conditioned upon. The bar chart above each column gives the atom’s value; unlike
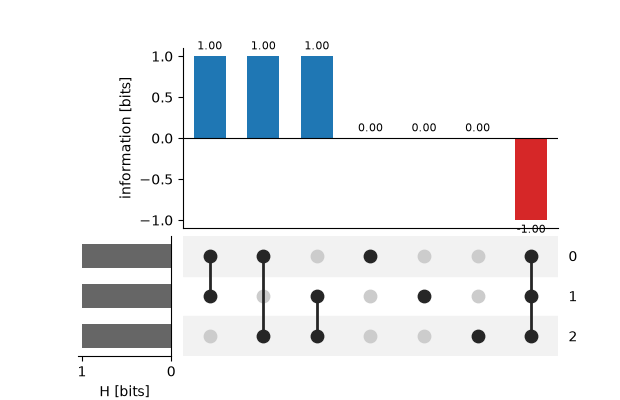
ordinary set cardinalities, information atoms may be negative (for example,
the co-information of xor is \(-1\) bit), so bars are colored by sign.
The bars beside the matrix give each variable’s marginal entropy
\(\H{X_i}\).
We reuse the four examples from [ASBY14]:
In [1]: import dit

In [2]: from dit.visualization import InformationUpsetPlot

In [3]: ex1 = dit.Distribution(['000', '001', '010', '011', '100', '101', '110', '111'], [1/8]*8)

In [4]: ex2 = dit.Distribution(['000', '111'], [1/2]*2)

In [5]: ex3 = dit.Distribution(['000', '001', '110', '111'], [1/4]*4)

In [6]: ex4 = dit.Distribution(['000', '011', '101', '110'], [1/4]*4)
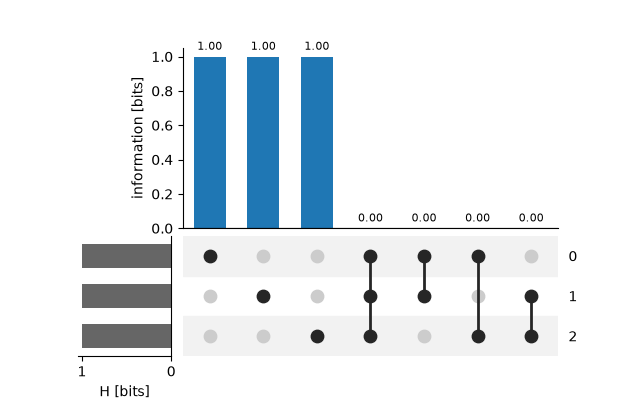
The independent distribution ex1 has only three nonzero atoms, one per
variable:
In [7]: InformationUpsetPlot(ex1).draw();
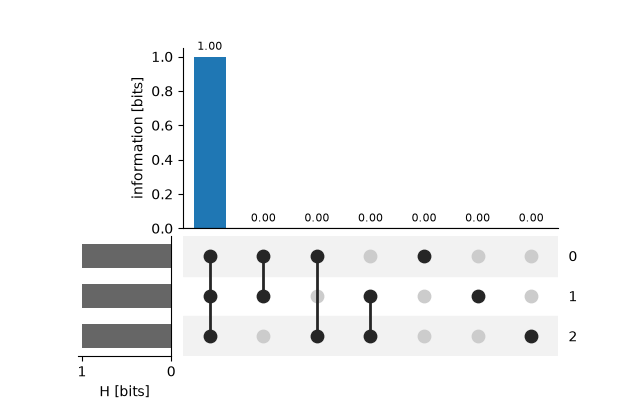
The giant bit ex2 concentrates all of its information in the single
three-way atom \(\I{X_0 : X_1 : X_2}\):
In [8]: InformationUpsetPlot(ex2).draw();
And ex4 (the xor distribution) exhibits a negative co-information atom:
In [9]: InformationUpsetPlot(ex4).draw();
The plot can be tuned: sort_by ("value", "magnitude", or
"degree") controls the column order, min_degree hides low-order atoms,
and show_values toggles the bar annotations. Passing partition lets you
visualize a different information diagram, such as the strictly-positive
X-diagram (ExtropyPartition).
- class InformationUpsetPlot(dist, *, partition=<class 'dit.profiles.information_partitions.ShannonPartition'>)[source]
An UpSet plot of the atoms of a distribution’s information diagram.
The plot has three coordinated panels:
a matrix whose rows are random variables and whose columns are the atoms of the information diagram; a filled dot means the variable participates in that atom (an unconditioned variable), an empty dot means it is conditioned upon;
an atom bar chart (above the matrix) giving each atom’s value, colored by sign since information atoms may be negative;
a variable bar chart (beside the matrix) giving each variable’s marginal entropy
H[X_i].
- dist
The distribution being visualized.
- Type:
Distribution
- partition
The information partition supplying the atoms.
- Type:
BaseInformationPartition
- atoms
One entry per atom, each with keys
members(frozenset of the participating variables),conditions(frozenset of the conditioned variables),degree(number of members) andvalue.
- draw(ax=None, *, sort_by='value', min_degree=1, show_values=True, color_positive='C0', color_negative='C3')[source]
Draw the UpSet plot using matplotlib.
- Parameters:
ax (Axis or None) – An existing matplotlib axis whose location is used to host the panels. If None, a new figure is created.
sort_by (str) – How to order the atom columns; see
_sorted_atoms().min_degree (int) – Only draw atoms of at least this degree.
show_values (bool) – Annotate each atom bar with its value.
color_positive (color) – The color for non-negative atoms.
color_negative (color) – The color for negative atoms.
- Returns:
axes – A dictionary with keys
"atoms","matrix", and"sizes"mapping to the three panel axes.- Return type: